
Google Analytics has long been the industry standard for website analytics in the private sector—but schools are starting to take advantage of the tool to better understand their web traffic. With a Google account and a snippet of code, you can open up a wealth of insights into who is visiting your website, how they’re getting there, and what content is getting people’s attention.
You may have heard that some changes are coming to Google Analytics. Google has announced that all users will be switched over to its new version of the platform by July 1st, 2023. Called Google Analytics 4, or simply GA4, this update introduces a few major changes for long-time users of the legacy Universal Analytics.
With GA4, the sooner you update your Google Analytics account the better. You don’t want to be caught by surprise. What’s more, GA4 can only collect data once it’s been implemented on your website. It also won’t retain historical data from your current Google Analytics account setup. So the perfect time to switch, if you haven’t already, is today. If you’re an Apptegy client, reach out and we can help you set up your school website with GA4.
One of the biggest challenges with the switch is the learning curve. In this guide, I’m going to provide a few easy steps to help with a comfortable navigation to GA4. Then, we’ll walk through how to access some of the reports you’re probably already familiar with but may not know how to find in GA4.
If you’re already set up with GA4, click here to dive right in!
Intro to GA4
The new Google Analytics experience is a lot simpler than the Universal Analytics dashboard you may be familiar with. In a lot of ways, that’s nice—there are fewer options to get lost in. On the flip side, it can be hard to find the pages or dashboards that you’re already familiar with.
The easiest part of making the switch to GA4 is actually getting set up. If you’re looking at your Admin menu, you’ll see something called GA4 Setup Assistant under your Property settings:
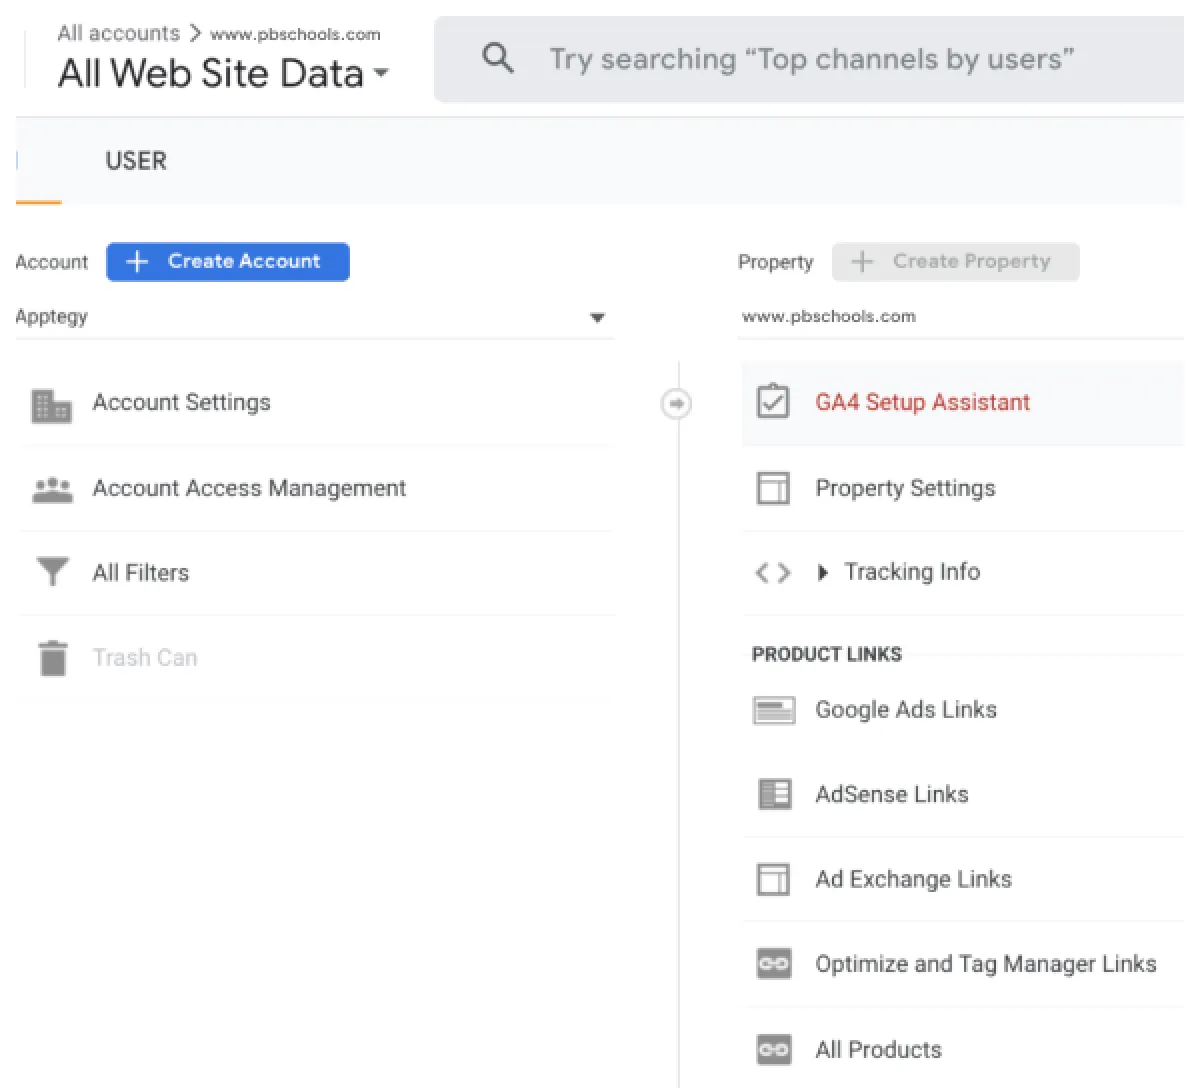
You’ll be able to get step-by-step instructions on how to create a new Property configured for GA4. This is pretty straight-forward since Google will tap into the existing Analytics code already in use on your website.
Finding your way in GA4
Several useful features in Google Analytics are still around in GA4, but are just accessed a little differently. Here’s how to find a few of our favorites.
Traffic by page
Understanding your web traffic is one of the key uses of Google Analytics. Your traffic is the number of users who have visited your site or a page on your site. This is useful because it helps you understand whether or not your web content is reaching your audience. If you have a page on your website about an upcoming bond issue, for example, you can look at the page’s traffic to see how many people are accessing that information.
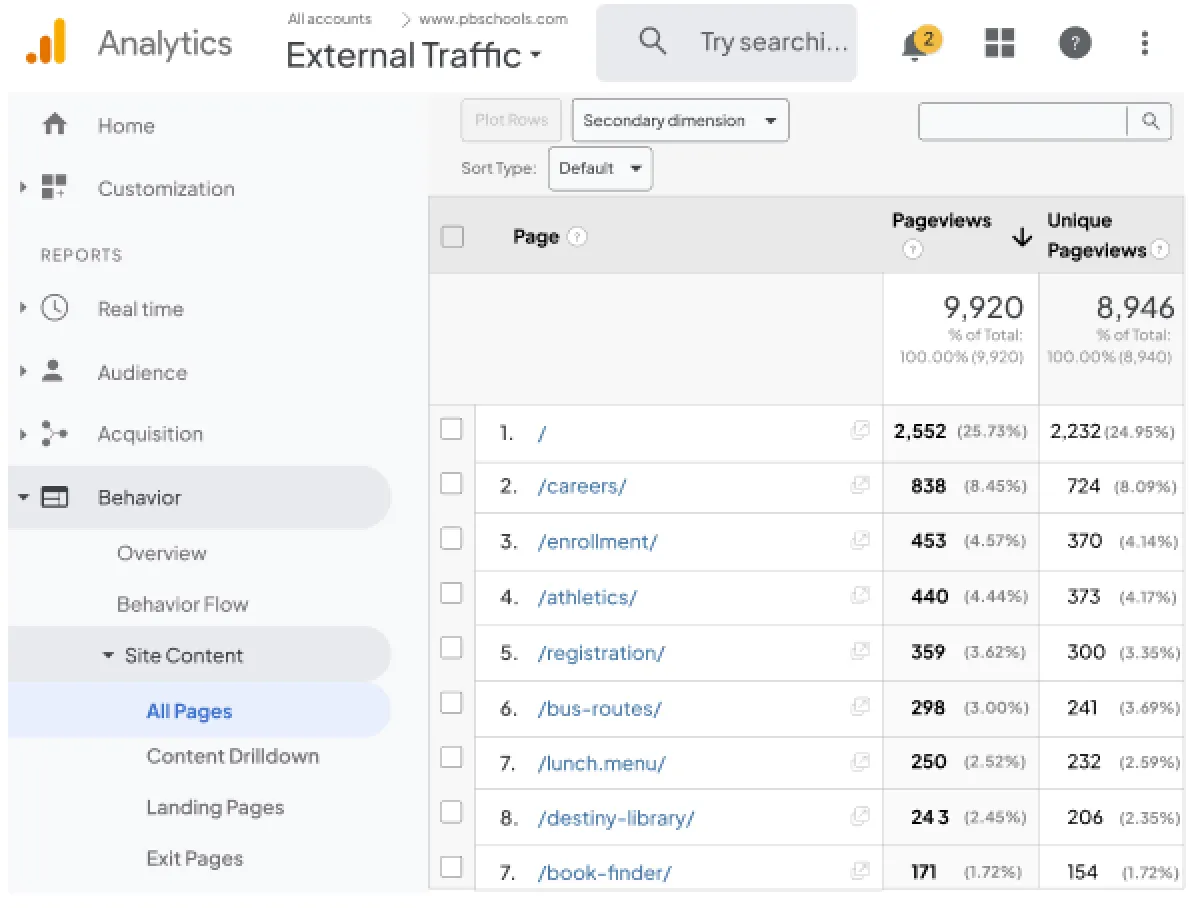
In Universal Analytics, you’re able to see which of your pages garner the most page traffic inside of the Behavior menu. From there, you can get a breakdown of traffic across all web pages under Site Content:
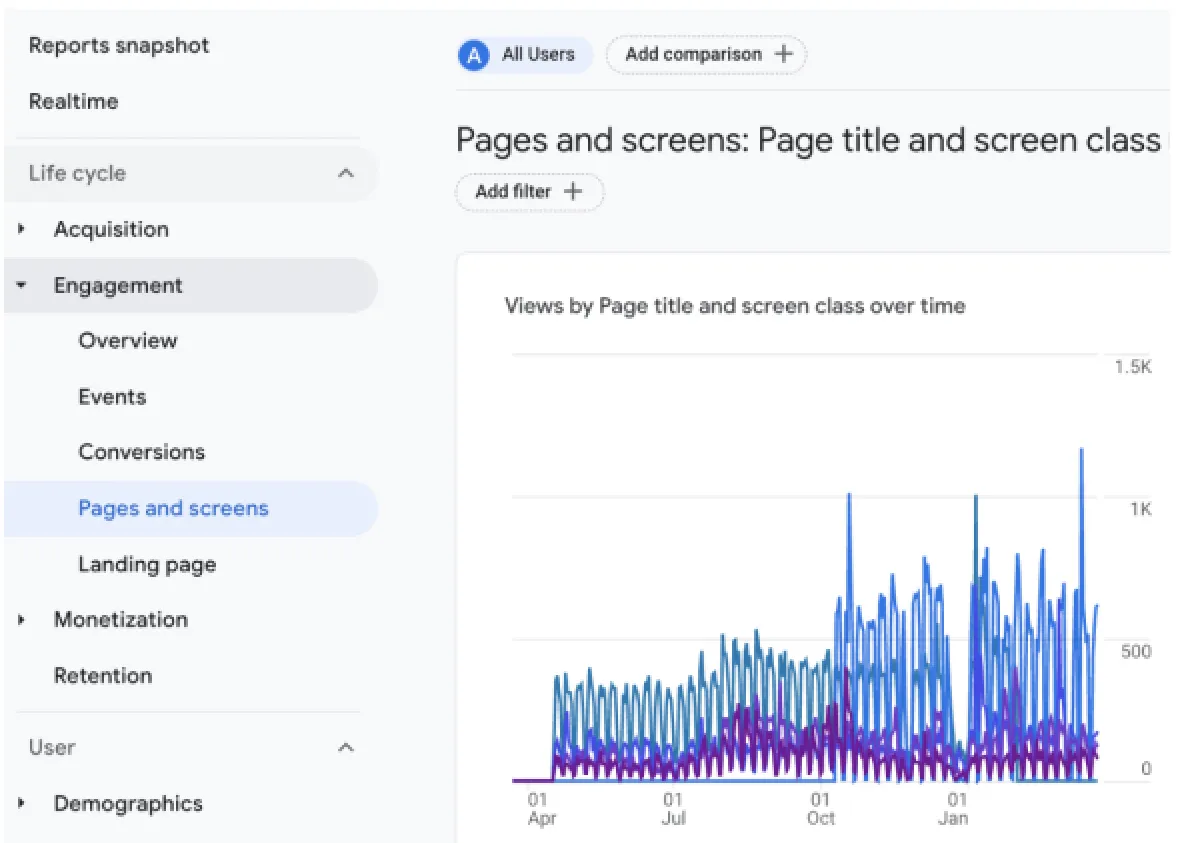
GA4 still offers these insights, just in a slightly different place. The Reports snapshot page is a one-stop shop for your website metrics. There’s a tab called Engagement that can take you to the Pages and screens report. There, you can find those same insights across different timeframes:
Traffic by subdirectory
What if you want to see page traffic not for a specific page, but for a whole suite of pages? One way to do this is by looking at traffic for a particular subdirectory or related part of a website. This could be your blog or your campuses. For example, you could have a news section with the setup www.school.com/article/name. You could check out all of your news articles and see which ones have been the most popular over the year.
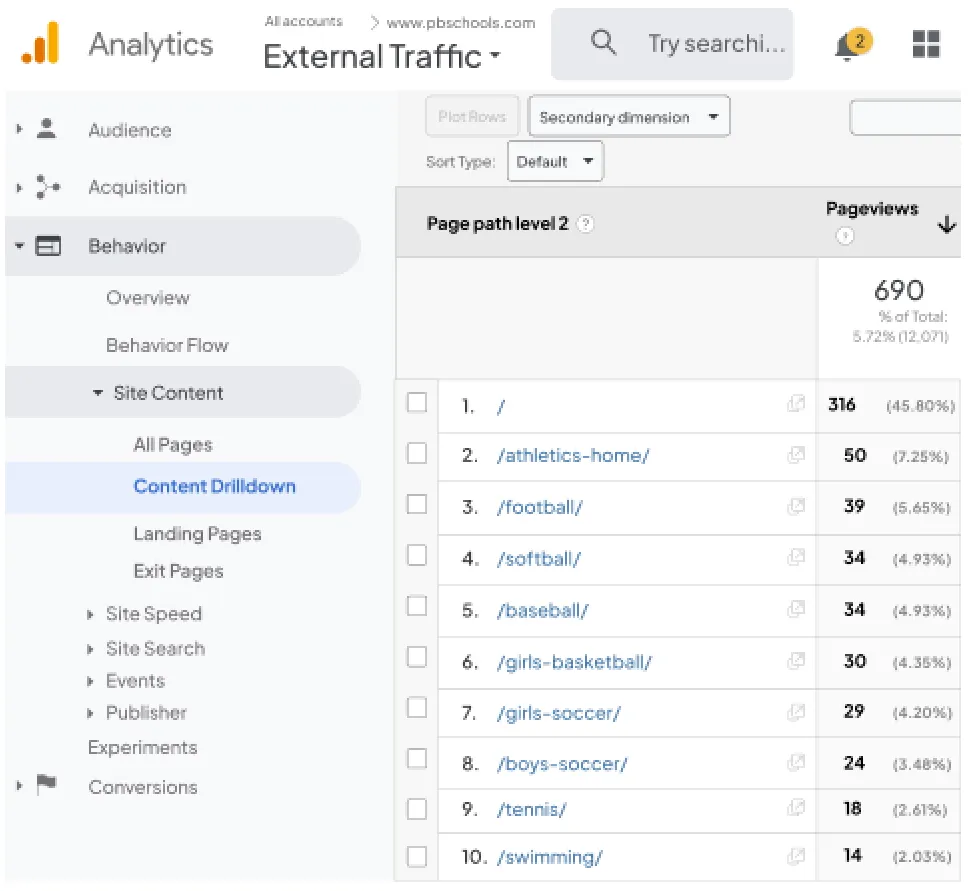
Currently, you can view your pages within a subdirectory by going to Content Drilldown within Site Content. Once there, you can click on a subdirectory and see all of these pages:
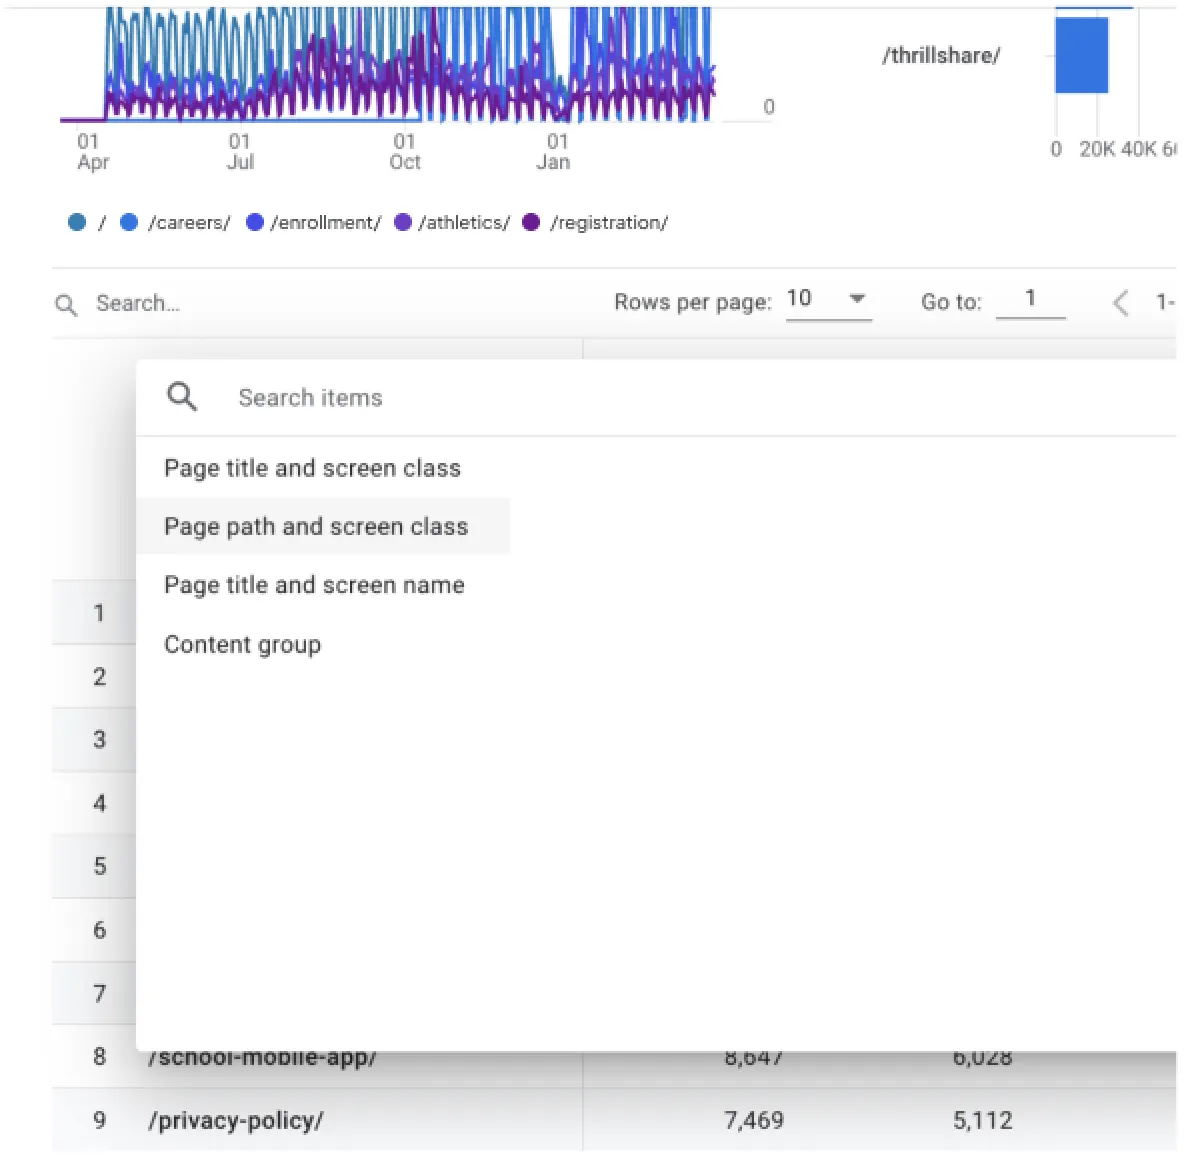
In GA4, things are more straightforward—you can access all this information in much the same way as your page traffic. However, it’s not exactly intuitive. You’ll want to go back to the Pages and screens tab in the Reports snapshot area. Your default view is by Page Title, which means the title of your webpage. However, you can change this. If you select Page path and screen class, you can change the view to show page url path instead.
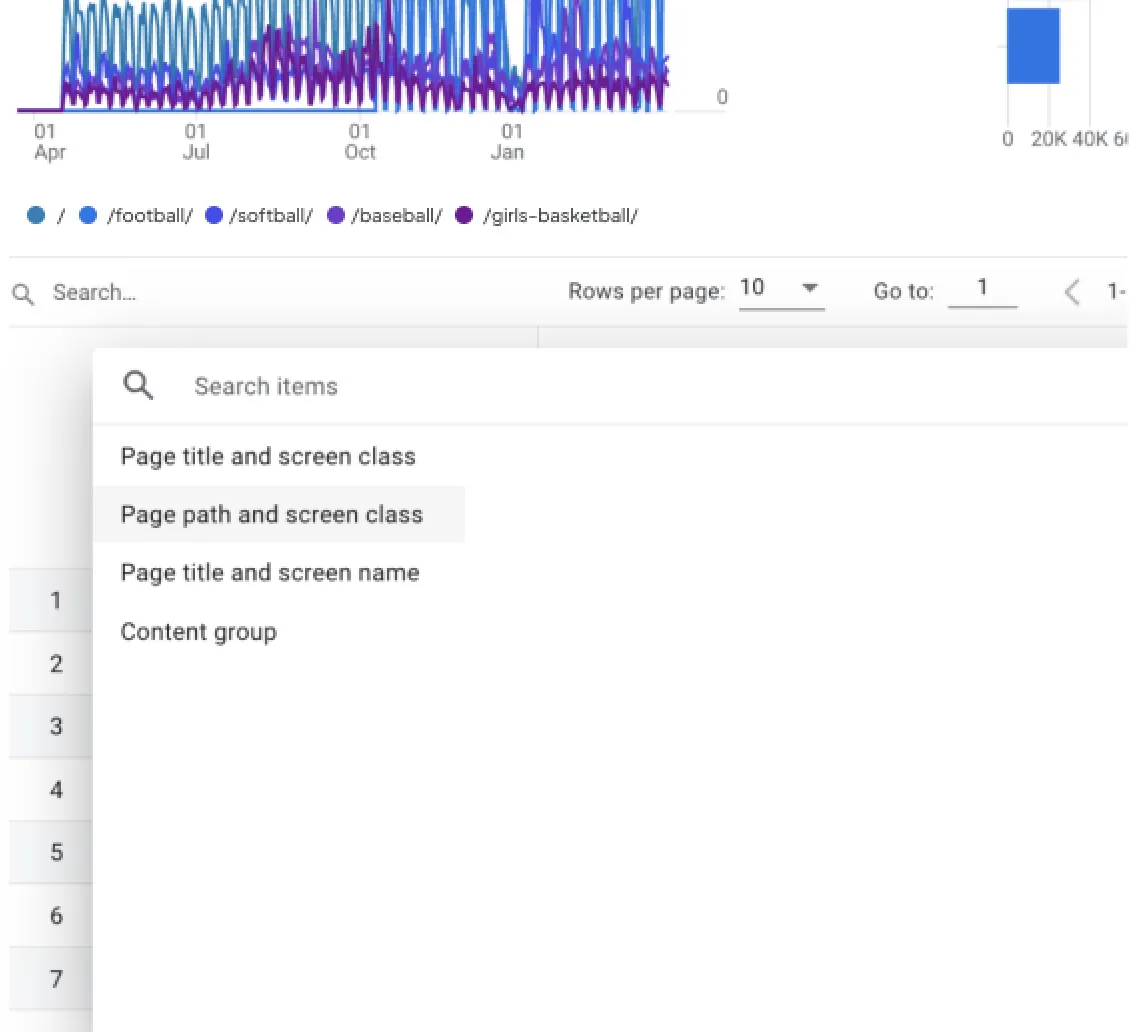
Then, simply type in the name of your subdirectory in the search bar (like athletics in our example) to see traffic for your top-performing pages under that folder:

Traffic by channel
Now that you know what parts of your website are getting the most traffic, the next step is figuring out what is driving traffic to your website—or how they get there. Your traffic channel is the way in which site visitors arrive to your website. There are all kinds of ways this can happen, from someone finding you on Google to clicking a link you shared on Facebook—or even just going to your website directly. Knowing how people are getting to your website lets you think more strategically about your website strategy. For example, if you’re getting a lot of direct site visitors but none from search engines, that’s a sign that district families are making use of your site but prospective families (or employees) might not be.
Understanding your website traffic is pretty straightforward in both Universal Analytics and GA4. The current version of Google Analytics has an Acquisition section that breaks down where your visitors are coming from. The basic view is found under Channels:
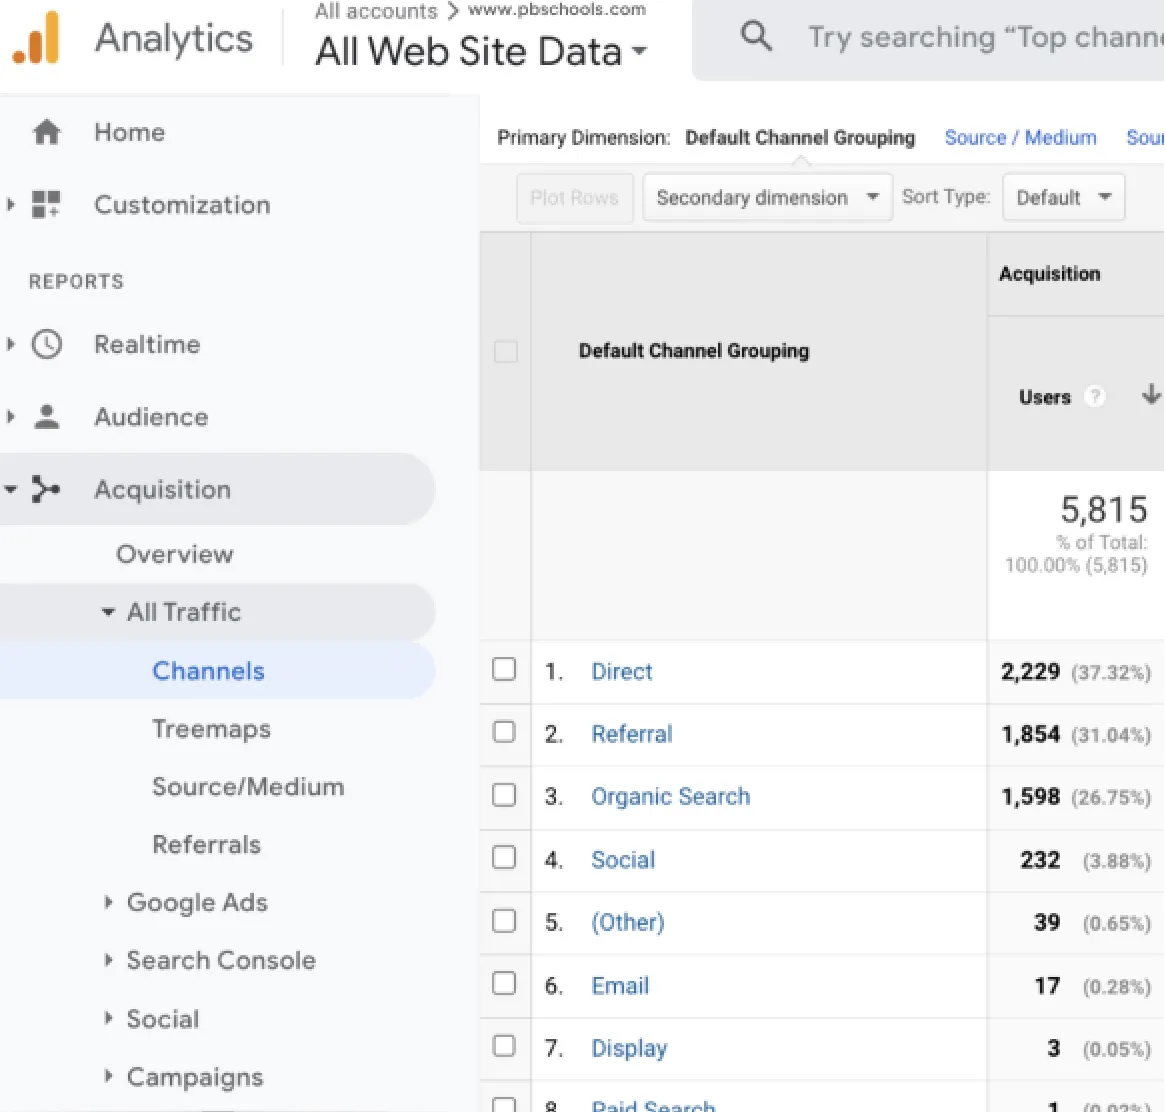
You can see the different ways people get to your website. You can get a little bit more detail by clicking on source—the exact origin of site visitors (such as Google or Bing vs organic search, for example) —in the menu above the table.
GA4 also has an Acquisition section, found in the Reports snapshot page. Interestingly, GA4 breaks the question of site traffic down into two slightly different buckets. There is the User acquisition view, which looks at new users by their first traffic source. Then, there’s the overall Traffic acquisition view, which looks at how both new and returning users get to your site.
Which one is better really depends on your specific objective, but for simplicity’s sake, the Traffic acquisition view provides the same data you’re used to seeing in the current form of Analytics:
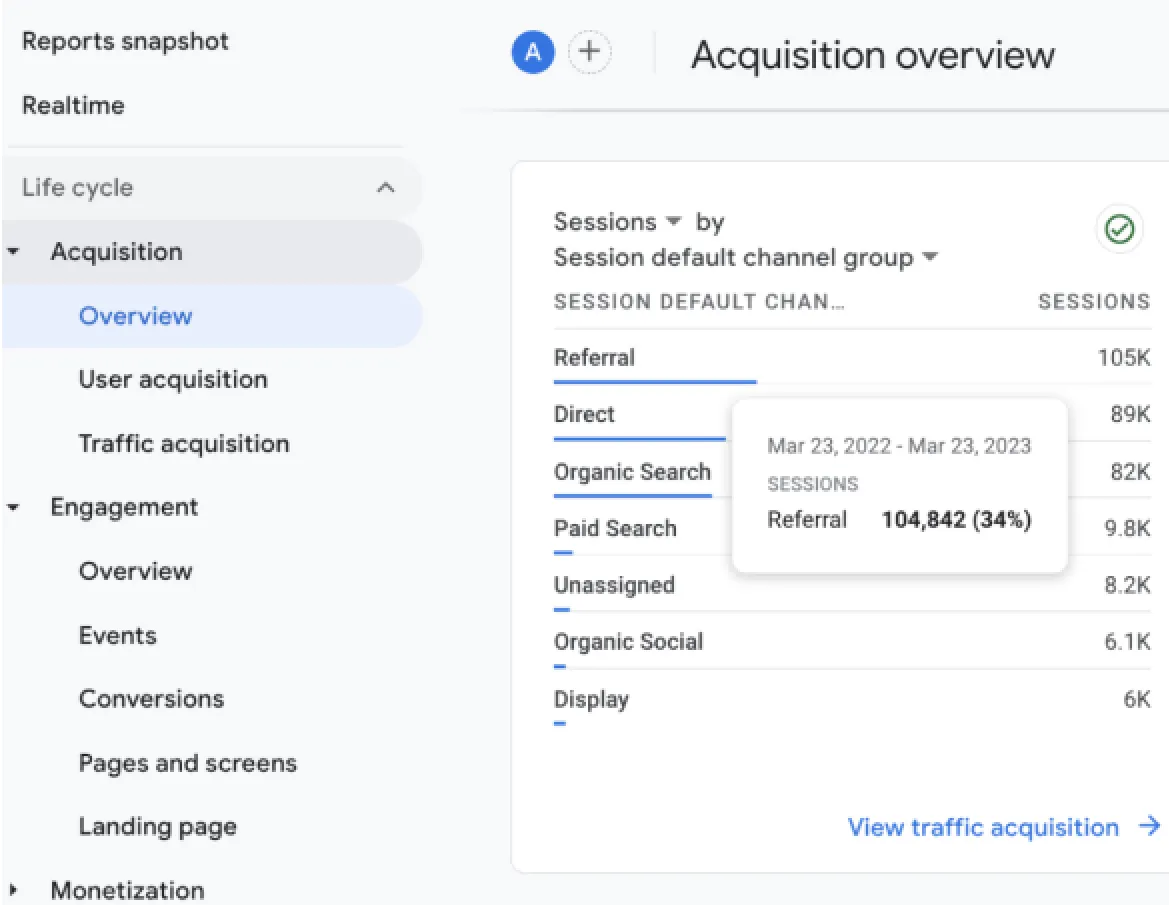
The categories of traffic here are the same. If you want to see a breakdown by source or medium, you’ll just click into the dropdown menu at the top of the table to select a different view of the data:
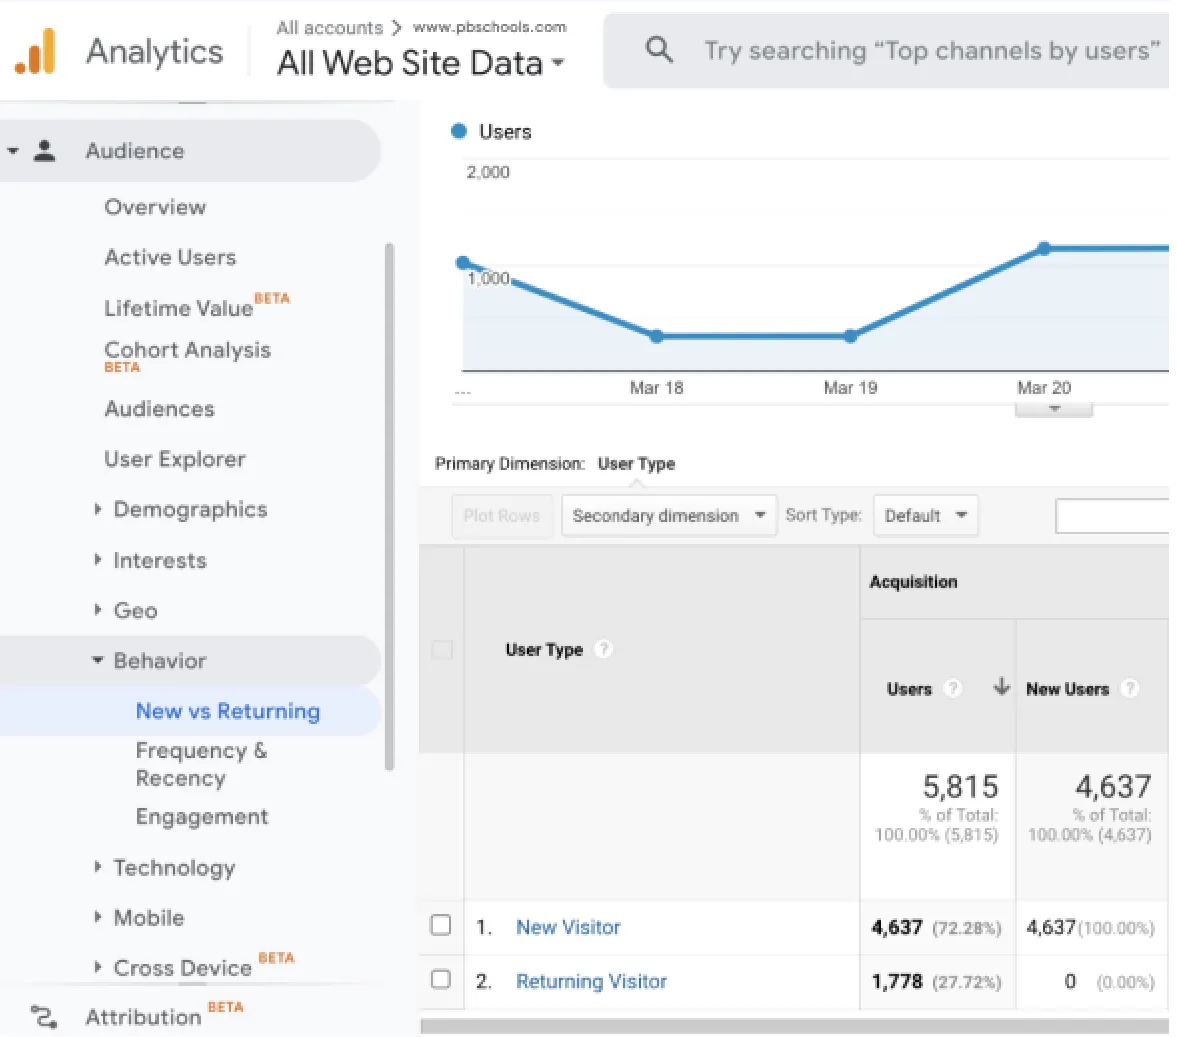
New vs returning traffic
Finally, you may be curious to see how much of your website traffic is new visitors vs returning visitors. That is to say, people who have been to your website before vs people who have not. This metric can help you understand whether you’re growing your reach and even let you know if parents are regularly visiting your website for things like the lunch menu or athletics information.
In Universal Analytics, you can see this information at a high level by going to the Audience menu and selecting Behavior and then New vs Returning. This view gives you a table breakdown of new visitors vs returning visitors across a variety of metrics, such as average session duration:
GA4 has a similarly straightforward home for his information. In the Reports snapshot page, scroll all the way down to Retention. This tab shows you line graphs of new users over time, as well as returning users by time:
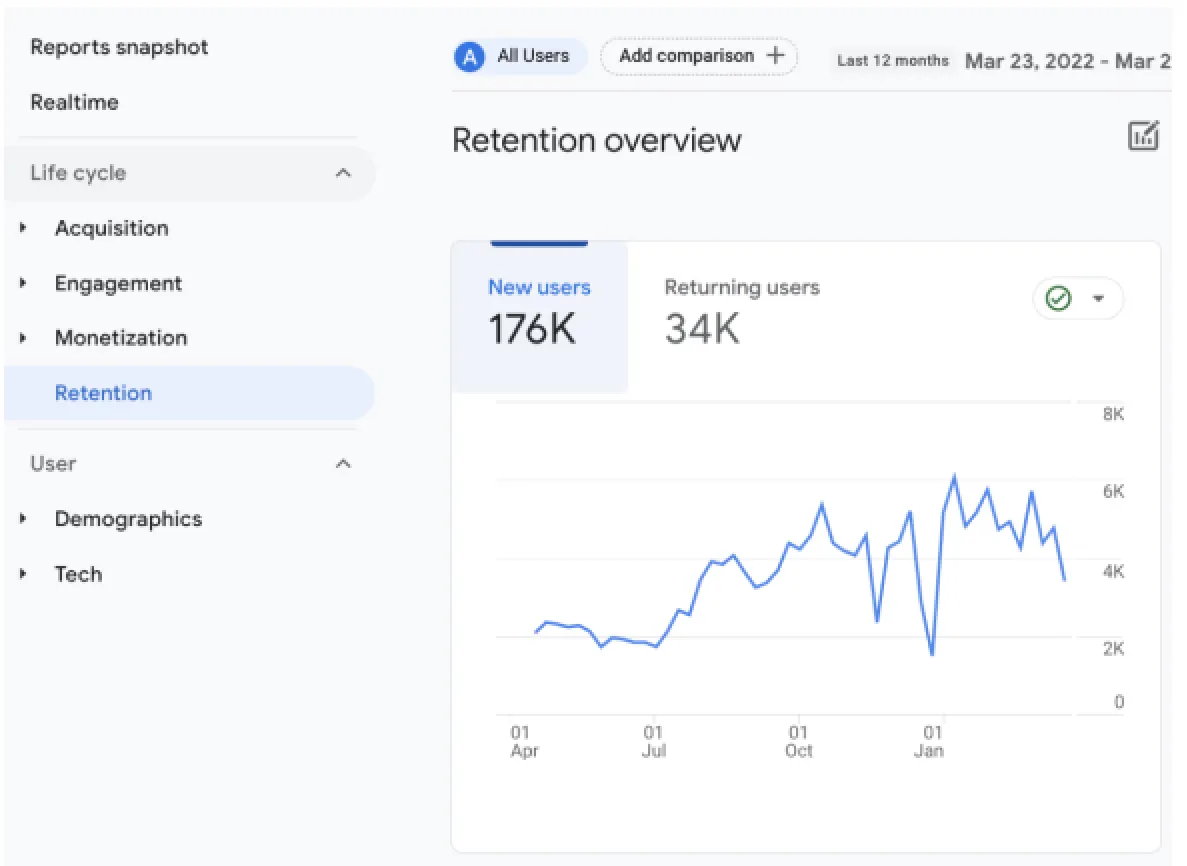
You’ll be able to see the numbers side by side at a glance and also chart the change in the metrics over a given time frame.
How to think about Google Analytics
I hope this comparison helps you better navigate GA4 as it becomes the default version of Google Analytics on July 1st, 2023. It can be an incredibly useful tool to help you understand your website’s performance.
I have one final note to share about Google Analytics as a whole: Let your goals, not your numbers, guide you. It can be very easy to fall down the data rabbit hole and focus on numbers rather than strategy. This isn’t productive. You’re not creating web pages and content for Google; you’re doing it for your audience. With that in mind, think about what you’d like to accomplish in regards to your audience and what you can do to get there.
If you want to get families visiting your school website, for example, don’t worry as much about tweaking individual pages to make them more captivating. Focus on how to generate website traffic as a whole. Are you sharing only time sensitive information? Or are you also sharing evergreen content that highlights the strengths and values of your schools? Are you using Facebook as your primary messaging tool? Try directing people to your site instead. Or maybe instead of scrutinizing how various news posts perform, focus on simply putting more content on the website.
When used well, Google Analytics can help shape your tactics and ensure that your web strategy is achieving the goals you want. So go ahead and dive into GA4. It can be a little intimidating (as all change is), but you’ll soon get the hang of the new layout and features. You’ll be a pro in no time!